Regional building permit values down 6.5% through October
by November 7, 2019 4:57 pm 423 views
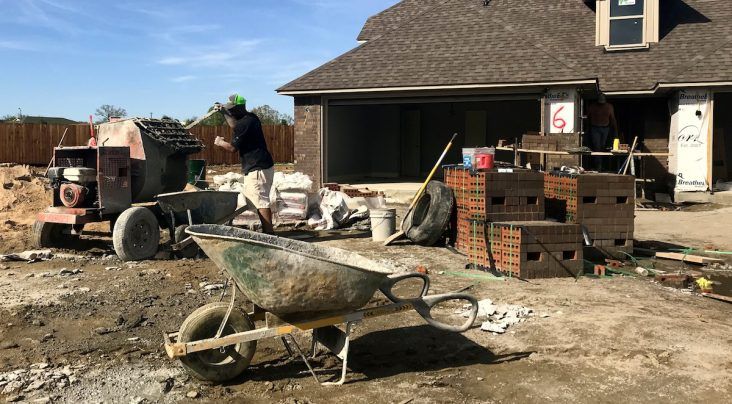
Residential construction work at Chaffee Crossing in east Fort Smith.
Building activity in the Arkansas River valley region dropped in October with year-to-date activity continuing to stay below numbers from 2018. Fort Smith, Van Buren and Greenwood issued $13.617 million in building permits in October, down 46% from September’s $25.192 million and down 24% from the $17.955 million issued in October 2018.
Year-to-date building activity for the region is $175.085 million, down a slight 6.5% from 2018’s permitted activity of $187.382 million for the same period.
Fort Smith’s building activity slowed in October. For the month, the region’s largest city issued 217 permits for a total value of $11.346 million, a 27.9% decrease from the $15.735 million valued on the 250 permits issued in September and a 28.8% decrease from the $15.945 million value of 176 permits issued in October 2018.
The residential growth so strong in September and August dropped by 53.9% from the $5.847 million in permitted activity in September in new residential construction to $2.696 million in permitted activity in October. October’s new residential construction was down 39.9% from October 2018’s $4.488 million in residential new construction.
On the commercial end, Fort Smith issued $500,000 on two new commercial construction projects. This is down 55% from the $1.118 million issued in September but up 35% from the $370,500 issued on three new construction projects in October 2018.
Van Buren, the region’s second-largest city, issued 50 permits totaling $1.067 million, down 87.45% from September’s total of $8.504 million. September’s total included a $6.01 million new construction project for Tankersley Food Service at 3201 Industrial Park Road. While still down slightly, the October total is more in line with August of this year and October 2018. October’s total valuations were down 38.7% from August’s total of $1.743 million and 8.3% from the $1.164 million of October 2018.
Van Buren’s October value included $860,000 on 12 residential permits and $100,000 on three commercial permits. For the first 10 months of 2019, Van Buren stands at $18.637 million in permitted building activity, down 44% from the $33.342 million in the same period of 2018.
Greenwood is the only city in the group to be ahead of 2018’s building permit valuations. The city issued eight permits in October, the same number issued in September, but the total came in 7.6% higher this past month with $1.025 million compared to $951,893 in September. Greenwood has issued $8.148 million in building permits so far this year, up 43% from the $5.642 million in the same time period of 2018.
REGIONAL BUILDING ACTIVITY RECAP
Combined total for the three cities
2018: $211.463 million
2017: $210.844 million
2016: $211.345 million
2015: $218.899 million
2014: $198.983 million
2013: $202.389 million
2012: $154.64 million
2011: $201.079 million
2010: $149 million
2009: $164 million
Fort Smith
2018: $187.678 million
2017: $169.958 million
2016: $185.783 million
2015: $191.631 million
2014: $174.252 million
2013: $185.057 million
2012: $136.248 million
Van Buren
2018: $17.629 million
2017: $19.665 million
2016: $15.327 million
2015: $16.009 million
2014: $7.918 million
2013: $8.283 million
2012: $8.609 million
Greenwood
2018: $6.156 million
2017: $15.23 million
2016: $10.235 million
2015: $11.259 million
2014: $16.813 million
2013: $9.049 million
2012: $9.983 million