Fort Smith metro building activity down more than 36% in the first quarter
by April 11, 2019 3:46 pm 911 views
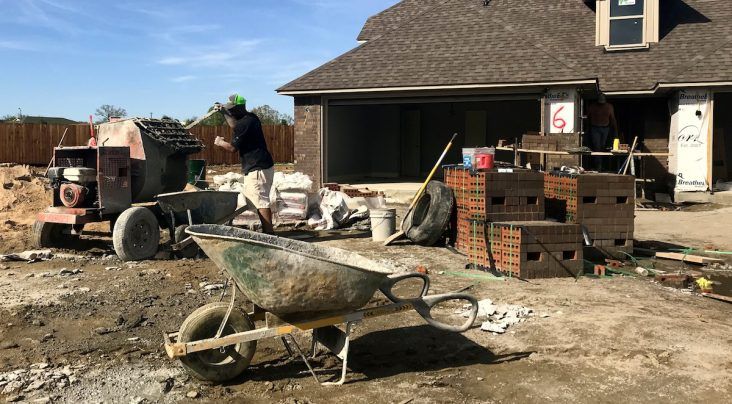
Residential construction work at Chaffee Crossing in east Fort Smith.
The first quarter of 2019 does not look good for the Fort Smith metro region’s building sector as permitting activity dropped by more than 36% in its three primary cities — Fort Smith, Van Buren and Greenwood.
Van Buren is the only city with a rise in permits as compared to the 2018 with a 0.5% gain in permit dollars. The three cities ended 2018 with a combined $211.463 million in permit values, just slightly ahead of the $210.844 million in 2017. (See info at end of story for regional permit history.)
Fort Smith ended the first quarter $22.5 million in building permits, a 39% decrease from 2018’s first quarter reporting of $37.243 million. That number was a 27.33% decrease from 2017.
In the first three months of the year, Fort Smith issued 447 total building permits. Three of those were for new commercial buildings, coming in $1.64 million. Those three buildings were a Moss Automotive storage building at 5406 S. 28th St.; a new warehouse for Coca Cola Bottling at 3600 Phoenix Ave.; and new motor building at 12112 Redwood Drive.
The residential sector saw better numbers with 22 permits for new construction of single family homes and four for new construction of duplexes. Total value for new residential construction was $6.96 million.
Activity picked up in the first week of the second quarter with permit values totaling $6.605 million on 45 permits. A $2.757 million permit was issued by the city for renovation of the former Shipley Baking building into an events center and future brewery. Bill Hanna, owner of Hanna Oil & Gas and chairman of the Central Business Improvement District, owns the Shipley building located on South Sixth street near the Fort Smith Convention Center. Plans presented to the CBID in September include a courtyard landscaped with a variety of shrubs, ornamental grasses, flowers, trees, and grass areas. Other features of the courtyard include a covered deck, stage area, bocce ball court, and benches.
Fort Smith officials also in early April issued a $1.5 million permit for work at 7501 Rogers Ave., to demolish a Hardee’s restaurant and build a Raising Cane’s restaurant. On the residential side, a $931,980 permit was issued for new home construction at 6800 Bentley Ridge Road.
Van Buren had first quarter new construction, combined residential and commercial, of $2.279 million with total permits for the quarter coming in at $3.232 million. In the first quarter of 2018, Van Buren totaled $3.215 million in new construction.
February had the highest new residential builds, $770,000, and new commercial builds, $759,000, of the quarter in Van Buren. January had the lowest with $170,000 in new residential build and no new commercial builds. March had $580,000 in new residential builds and no new commercial. Total figures were $444,500 for January, $1.978 million for February and $809,300 for March.
Greenwood had $1.93 million in buildings in the first quarter, down 23.4% from 2018’s 2.52 million. Of that $799,833 was new residential building. There was no new commercial listed in Greenwood for the first quarter of the year.
Again, the highest month overall was February, though new residential building was higher in March with $371,145. Breaking it down by month shows $479,120 for January, $797,053 for February and $656,145 for March.
REGIONAL BUILDING ACTIVITY RECAP
Combined total for the three cities
2018: $211.463 million
2017: $210.844 million
2016: $211.345 million
2015: $218.899 million
2014: $198.983 million
2013: $202.389 million
2012: $154.64 million
2011: $201.079 million
2010: $149 million
2009: $164 million
Fort Smith
2018: $187.678 million
2017: $169.958 million
2016: $185.783 million
2015: $191.631 million
2014: $174.252 million
2013: $185.057 million
2012: $136.248 million
Van Buren
2018: $17.629 million
2017: $19.665 million
2016: $15.327 million
2015: $16.009 million
2014: $7.918 million
2013: $8.283 million
2012: $8.609 million
Greenwood
2018: $6.156 million
2017: $15.23 million
2016: $10.235 million
2015: $11.259 million
2014: $16.813 million
2013: $9.049 million
2012: $9.983 million