Building activity in the Fort Smith metro tops 2018 numbers
by January 8, 2020 3:35 pm 1,487 views
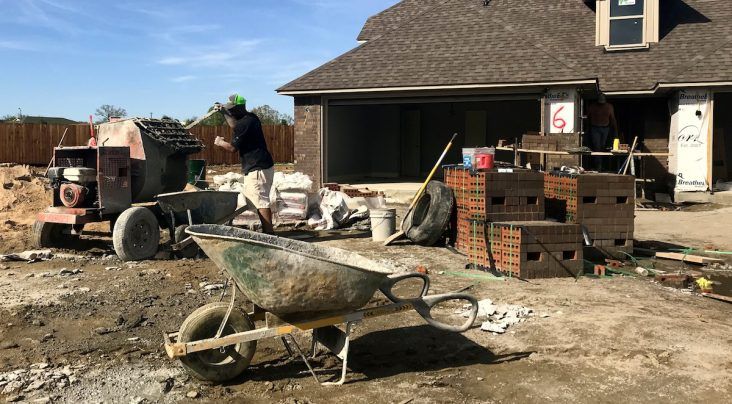
Residential construction work at Chaffee Crossing in east Fort Smith.
Building activity in the Fort Smith region ended 2019 ahead of 2018 thanks to a flurry of building in Fort Smith in the final 30 days of the year. The region ended the year with $238.752 million in permitted building activity, a 3% increase from 2018’s $231.78 million and a 13% increase from 2017’s $210.844 million.
Fort Smith and Greenwood both showed a gain in building activity over the previous year, while Van Buren posted a drop in its numbers.
December was overall good for the region with building activity coming in at a combined $53.358 million, compared to December 2018’s $14.04 million — a 280% increase.
For the year, Fort Smith was up from the previous year with $204.008 million against $187.678 million in 2018, up 8.7%, making 2019 the best performing year in the past 10. Going into December, the city was behind 2018 numbers, but the 162 permits issued in December, with a valuation of $51.492 million, more than made up the difference. The month’s valuations came in 647% higher than November’s $6.89 million on 143 permits.
In December, Fort Smith saw $17.55 million in new commercial construction, a dramatic 1200% increase from November’s $1.35 million in new commercial construction. Construction of the new addition at Southside High school gave a big boost to the December new commercial construction permit valuations.
Fort Smith Public Schools board members and administrators broke ground on the first phase of a $35 million, multi-phase construction project for the school Oct. 28. The SHS project will include a 12-classroom freshman center addition and a new competition gym with seating for at least 2,300 and an integrated storm shelter, along with a new standalone storm shelter, cafeteria renovation, media center renovation, new administrative office addition and possible South Gym renovation. Two permits were issued for construction at the school in December, one for $13.63 million and one for $2.03 million.
Fort Smith voters approved a millage increase in 2018, raising the millage rate in Fort Smith from 36.5 mills to 42 mills. The new rate is expected to raise $120.822 million, a portion of which will go to new additions at both FSPS high schools.
Fort Smith new residential construction also was strong in December with $4.9 million in permitted activity, a 650% increase from November’s $653,615 in new residential construction.
For the year, new commercial construction permits accounted for $32.724 million with some of the notable projects including the $15.66 million for Southside High School; $2.757 million for renovation of the former Shipley Baking building downtown; and $4.9 million for a hotel project at 7111 Phoenix Ave. by Marion Driscoll Construction. New residential construction came in at $44.231 million for the year.
Greenwood also came in higher than last year with a reported $9.028 million for the year, a 28.7% increase from the $7.013 million it reported in building permit valuations in 2018. Van Buren, however, dipped in its numbers for 2019, reporting $27.73 million permitted valuations for the year, compared to $37.946 million reported in 2018, a 26.9% decrease.
REGIONAL BUILDING ACTIVITY RECAP
Combined total for the three cities
2019: $238.752 million
2018: $231.780 million
2017: $210.844 million
2016: $211.345 million
2015: $218.899 million
2014: $198.983 million
2013: $202.389 million
2012: $154.64 million
2011: $201.079 million
2010: $149 million
2009: $164 million
Fort Smith
2019: $204.008 million
2018: $187.678 million
2017: $169.958 million
2016: $185.783 million
2015: $191.631 million
2014: $174.252 million
2013: $185.057 million
2012: $136.248 million
Van Buren
2019: $27.731 million
2018: $37.946 million
2017: $19.665 million
2016: $15.327 million
2015: $16.009 million
2014: $7.918 million
2013: $8.283 million
2012: $8.609 million
Greenwood
2019: $7.013 million
2018: $6.156 million
2017: $15.23 million
2016: $10.235 million
2015: $11.259 million
2014: $16.813 million
2013: $9.049 million
2012: $9.983 million