Fort Smith metro building permit values down 8.2% in July
by August 8, 2019 6:14 pm 584 views
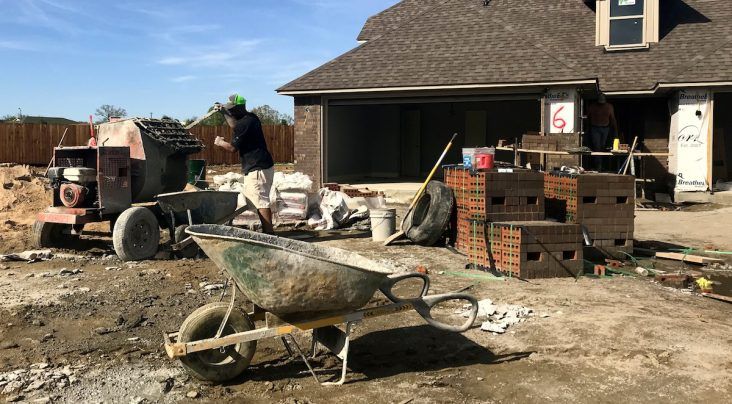
Residential construction work at Chaffee Crossing in east Fort Smith.
Regional building activity for Fort Smith, Greenwood and Van Buren dropped dramatically in July after a robust June. Building permit values in the three cities combined for a total of $17.348 million in July, down 33% from $25.736 million in June, and down more than 8% from $18.989 million in July 2018.
This keeps the region continuing in the 2019 pattern of being down from 2018’s building permit activity. Year-to-date, the region is at $108.161 million in total permit values, down 19% from the $133.812 million for January through July 2018.
Fort Smith issued 272 building permits in July, mostly for repairs and renovation, for a total value of $14.287 million, down 36% from June’s $22.366 million and down 10% from the $15.958 in July 2018.
There weren’t a number of bigger projects listed in July. A permit for the $2.5 million renovation of Fort Smith Boys and Girls Club’s Hunt’s Park was issued. Renovation plans include replacing the in-field and north and east fences with black chain link; replace the current grass football and baseball fields with sports turf to eliminate the problems that come with inclement weather; replace the wooden bleachers at the football field with handicap accessible bleachers; replace the football press box; add a concession stand to the bathroom and remodel those facilities; remodel the baseball concession stand and press box; add a new roof over the batting cages; add in-play fabric screen, replace field lights with LED lights; and install security cameras and new signage, said Travis Beshears with Beshears Construction, a member of the FSBG board of directors.
The only new commercial construction in Fort Smith in July was at 6220 Massard Road, a $600,000 project to include the new veterinarian clinic for Dr. Lance Fouts and Anytime Fitness at Chaffee Crossing. There also was only one new construction commercial permit issued in June — the $2.208 million for work at 8210 Phoenix Ave. by Chambers Bank. Even still, July’s new commercial construction came in at 78% less than June.
Total new residential construction in Fort Smith during July generated $1.57 million in permit values, a dramatic 81% drop from June’s new housing values of $8.23 million.
Van Buren, the region’s second largest city, finished July on a strong note. The city issued 61 permits in July totaling $2.697 million, a 47.6% increase from June’s 1.827 million. This included $1.348 million on 11 residential permits and $1.344 on seven commercial permits. June’s total include $1.45 million in commercial construction and $377,000 in residential permits. The city’s July numbers, however, were down nearly 2% from July 2018’s $2.751 million on 47 projects. For the first seven months of 2019, Van Buren stands at $9.817 million in permitted building activity, against a seven-month total of $16.76 million in 2018, a 41% decrease.
Greenwood had five permits in July totaling $363,828, down 75% from the $1.543 million of the three permits issued in June. It is however on par with the $357,700 issued in May. Greenwood’s numbers are up 30% from July 2018’s $280,736 in permit valuation. Year to date, Greenwood has logged $5.141 million against $4.372 through July 2018, an increase of 17.6%.
REGIONAL BUILDING ACTIVITY RECAP
Combined total for the three cities
2018: $211.463 million
2017: $210.844 million
2016: $211.345 million
2015: $218.899 million
2014: $198.983 million
2013: $202.389 million
2012: $154.64 million
2011: $201.079 million
2010: $149 million
2009: $164 million
Fort Smith
2018: $187.678 million
2017: $169.958 million
2016: $185.783 million
2015: $191.631 million
2014: $174.252 million
2013: $185.057 million
2012: $136.248 million
Van Buren
2018: $17.629 million
2017: $19.665 million
2016: $15.327 million
2015: $16.009 million
2014: $7.918 million
2013: $8.283 million
2012: $8.609 million
Greenwood
2018: $6.156 million
2017: $15.23 million
2016: $10.235 million
2015: $11.259 million
2014: $16.813 million
2013: $9.049 million
2012: $9.983 million