U.S. GDP drops by 4.8% in the first quarter; full COVID impact not in the report
by April 29, 2020 1:13 pm 1,179 views

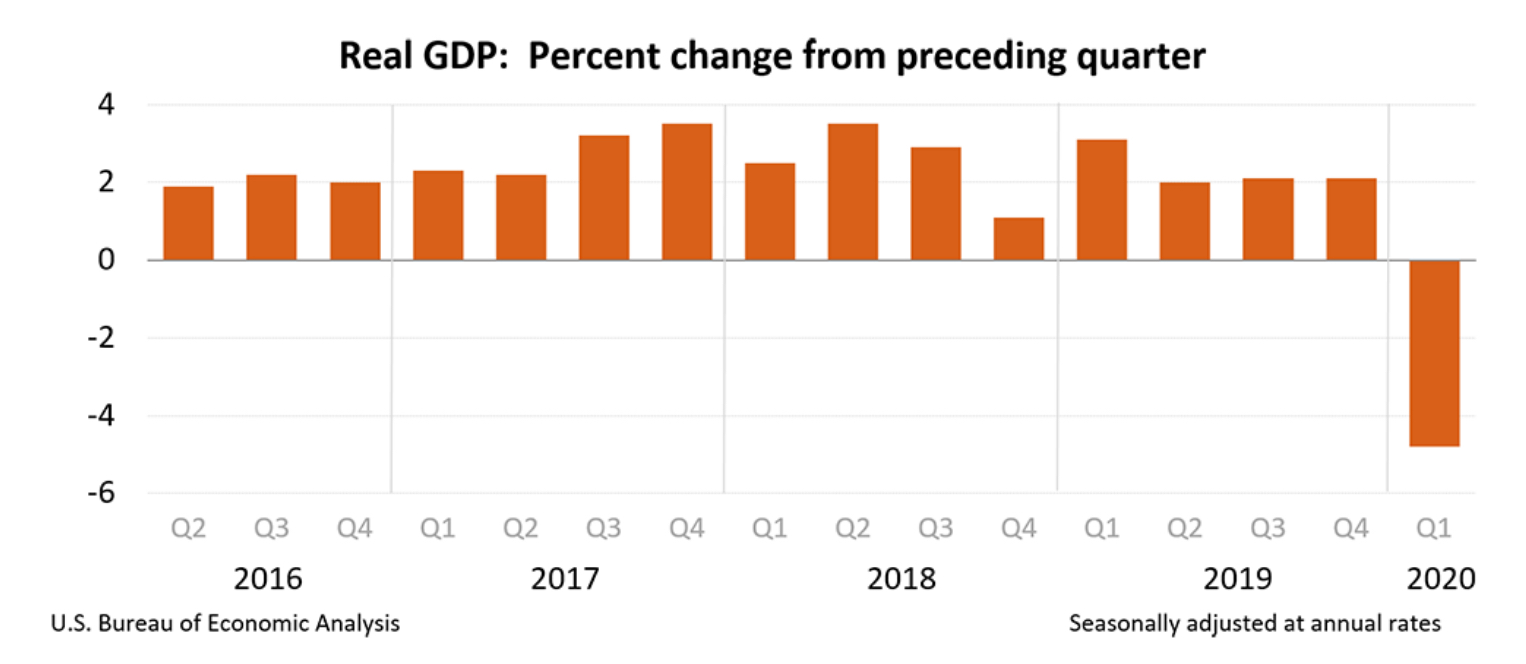
The initial estimate of the first quarter U.S. gross domestic product (GDP) fell at an annual rate of 4.8%, reflecting the first impacts of COVID-19 on the economy. The decline was the most since an 8.4% decline in the fourth quarter of 2008.
Wednesday’s (April 29) report from the U.S. Bureau of Economic Analysis (BEA) also noted that the fourth quarter GDP was up 2.1%. The BEA noted that a shelter-in-place order and other directives issued by federal, state and local governments resulted in “rapid changes in demand, as businesses and schools switched to remote work or canceled operations, and consumers canceled, restricted, or redirected their spending.”
The BEA also noted that the full impact of COVID-19 on the economy is not captured in the initial estimate.
“The full economic effects of the COVID-19 pandemic cannot be quantified in the GDP estimate for the first quarter of 2020 because the impacts are generally embedded in source data and cannot be separately identified,” the BEA report said.
The Conference Board and the Congressional Budget Office have said the second-quarter GDP will mark the first full impact of COVID-19. The CBO has estimated the GDP could fall at a 40% annual rate in the second quarter. Erik Lundh, a senior economist with The Conference Board, estimates a GDP decline of between 38.8% and 43.7% in the second quarter.
“While this contraction is not unexpected, it should be noted that social distancing policies only began to be widely implemented in the United States in mid-March. Because of this, the pandemic’s impact on the US economy was limited to the very end of Q1 and is impacting Q2 much more severely. … The degree of the contraction will depend on the path the virus takes through June and the degree to which the economy is ‘reopened,’” Lundh noted.
 Following are key points in the GDP report.
• The decrease in real GDP in the first quarter reflected negative contributions from personal consumption expenditures (PCE), nonresidential fixed investment, exports, and private inventory investment that were partly offset by positive contributions from residential fixed investment, federal government spending, and state and local government spending.
• The decrease in PCE reflected decreases in services, led by health care, and goods, led by motor vehicles and parts. The decrease in nonresidential fixed investment primarily reflected a decrease in equipment, led by transportation equipment. The decrease in exports primarily reflected a decrease in services, led by travel.
• Current‑dollar GDP decreased by 3.5%, or $191.2 billion, in the first quarter to a level of $21.54 trillion.
• Current-dollar personal income increased $95.2 billion in the first quarter, compared with an increase of $144.1 billion in the fourth quarter.
• Disposable personal income increased $76.7 billion, or 1.9%, in the first quarter, compared with an increase of $123.7 billion, or 3%, in the fourth quarter. Real disposable personal income increased by 0.5%, compared with an increase of 1.6%.
• Personal outlays decreased $253.5 billion, after increasing $118.8 billion. The decrease was mainly accounted for by a decrease in PCE.
• Personal saving was $1.6 trillion in the first quarter, compared with $1.27 trillion in the fourth quarter. The personal saving rate – personal saving as a percentage of disposable personal income – was 9.6% in the first quarter, compared with 7.6% in the fourth quarter.
“The drop seen in consumption was broader than expected – going beyond categories like food service and accommodations. Healthcare services, for instance, saw a very large contraction. Additionally, personal incomes continued to grow in Q1 but personal savings jumped to 9.6 percent from 7.6 percent in the previous quarter,” Lundh wrote in his assessment.