Meat is the big spend by Arkansas consumers while grocery shopping
by October 17, 2018 4:04 pm 1,122 views
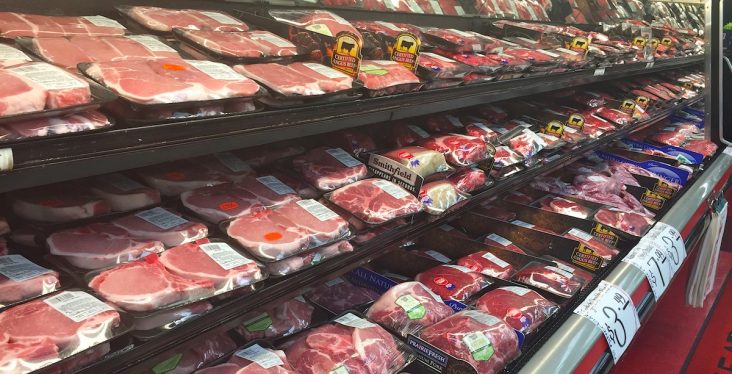
Grocery stores around the Natural State sold more meat to consumers in 2012 – the latest available data – than any other category, according to economic census data conducted by the U.S. Census Bureau.
The grocery store sales report for Arkansas indicates meat, poultry and prepackaged meats comprised 14.3% of the grocery sales in 2012. That value was $466.567 million.
The report found Arkansans purchased more meat than average consumers around the country as this category comprised 10.5% of grocery store sales in the the U.S. The U.S. Census Bureau recently released the data for every state and said this report is compiled every five years and the data for the 2017 Economic Census began in May and dissemination of those results will begin in 2019.
Other states ranking higher than Arkansas’ share of meat and poultry sales were Puerto Rico at 19.8%, Louisiana at 16.% and Mississippi at 15.1%. Alabama and Oklahoma ranked just below Arkansas for share of meat sales at 13.8% and 13.4%, respectively.
Arkansans also purchased more seafood and fish than the average U.S. consumer. Arkansas grocery stores sold $91.706 million of fish and seafood to consumers in 2012, or 2.8% of the total gross sales. Nationally, fish and seafood accounted for 2.4% of total sales. The states where fish and seafood comprised the biggest share of sales were Colorado, 4.7%; Kentucky, 4.5%; Georgia, New Mexico and West Virginia each with 4.1%.
Delicatessen sales by Arkansas grocery stores totaled $72.994 million in 2012, or 2.2% of total sales. This was less than the 3.8% at the national level and considerably less than those states with biggest deli spend. District of Columbia led the spend at 6.5% and was followed by New Jersey at 6.3% and Missouri at 6.2%.
Frozen food sales reported by Arkansas grocery stores totaled $164.102 million in 2012, or 5% of the total. The was close to the national average of 5.2%. California led the nation at 6.9%, Nevada was slightly less at 6.8% while Iowa, North Dakota and Idaho was 6.3%, 6.2% and 6.1%, respectively.
Fresh produce sales of fruits and vegetables totaled $224.789 million among Arkansas grocers in the report. This was 6.9% of total sales. Arkansans purchased considerably less produce than consumers nationally where the food group comprised 9.2% of sales. District of Columbia and Rhode Island led the nation at 13.5% and 12%, respectively.
Dairy products comprised 5.5% of sales by Arkansas grocery stores in the report. This compared to 7.1% of sales by national grocery stores. The total dairy sales by Arkansas grocery stores was $179.020 million in 2012. Puerto Rico led the nation at 15.1%, while New Hampshire and North Dakota each were 12.1% of sales.
Indulgent foods such as candy and prepackaged snacks had sales of $84.895 million among Arkansas grocery stores, the comprised 2.6% of total sales. That compared against 3.4% of sales for all U.S. grocery. Hawaii had the most candy and snack sales by percentage at 6.1%, and North Carolina was next at 5.3%.
Bottled soft drinks and other non-alcoholic beverages comprised 3.2% of Arkansas grocery store sales in 2012. This totaled $104.735 million. It was slightly less than the 4% of for all U.S. grocers. Delaware had the highest category spend at 7.1%, while Maine was second at 6.9% of total grocery sales in that state.
One area where Arkansas grocers lagged was in total beer and ale sales. The state’s grocery stores had category sales of $18.814 million, or 0.6%, according to the report. This compares to 2.1% for all the grocers in the U.S. Oregon had the most beer and alcohol sales by category at 4.5%, and Iowa and Maine tied for second at 4.1%.
Prescription drug sales totaled $112.358 million among Arkansas grocery stores in 2012, or 3.4% of total Arkansas sales, compared with 4% nationally. Kansas had the largest share of prescription drug category sales at 10.1%. The next largest was Iowa at 8.%.
There have been several recent trends likely to alter the data in the next report. Consumers overall are buying less frozen foods and opting more for fresh. Soda consumption is down in the U.S. with more shoppers purchasing water, teas, coffee and sport drinks while forgoing carbonated, sugary or diet sodas. Statista reports 15% of consumers never drink soda while 32% drink it a few times a month.
Yogurt consumption is up in recent years and this is likely to drive daily sales higher in the next report. Transparency Market Research expects yogurt consumption in North America will grow from an $11.18 billion market in 2011 to a $14.59 billion market by 2024.
Snacking is the hottest trend in food retail and better-for-you snacks are being favored by consumers. Nielsen reported in March snacks sales were booming across the globe. In the U.S. snack sales are experiencing a compounded annual growth rate of 10% between 2012 and 2016.
Certain single-serving products are also growing in popularity. Analysts with NPD Group have said indulgent snacks are one area where single-serving is making a hit. This is another category expected to be impacted by the next report.
As more retailers add beer and ale to their product offerings this category is likely to grow in Arkansas grocery stores by the next report. For example, Benton County was not “wet” when this data was collected. County voters approved a wet measure in the November 2012 election. The first sales took place in mid-2013. Given Benton County is one of the most populated in the state, this will likely increase the beer and ale category sales in the 2019 report.