The Compass Report: Northwest Arkansas, Jonesboro metro economies end 2017 with positive numbers
by July 8, 2018 7:13 pm 1,064 views
Arkansas’ two northern metro areas posted impressive economic growth in the second half of 2017, and three of the state’s four metro areas measured by The Compass Report posted job gains to finish out the year.
Nonfarm employment in central Arkansas grew by 6,200 jobs, or 1.7%, from December 2016 to December 2017. By comparison, the Northwest Arkansas regional economy grew 2.8%, adding 7,000 jobs. The Jonesboro metro area also grew at a rate of 2.8% and added 1,600 jobs. The Fort Smith regional economy lost roughly 2,100 jobs, or 1.8%, during the same period.
The quarterly Compass Report is managed by Talk Business & Politics, and is sponsored by Lowell-based Zero Mountain Logistics, a subsidiary of Fort Smith-based Zero Mountain Inc. The report is the only independent analysis of economic conditions in four Arkansas metro areas: Central Arkansas, Northwest Arkansas, the Fort Smith metro and the Jonesboro metro. Because of timing issues and analysis delays, this report provides third quarter and fourth quarter grading and data for the four regions.
To underscore the impact of the four largest metro areas, for December, the unemployment rate for the rest of the state was 3.9%. The statewide unemployment rate with the three largest metros added back in was 3.6%. The gap had been much greater, but much of the state, at least in terms of unemployment rate, has improved, while Fort Smith has regressed.
Jeff Collins, the economist for Talk Business & Politics who gathers data used in The Compass Report, said Northwest Arkansas continues to be the state’s best performing metro economy, even with declines in some areas.
“The number of building permits in the fourth quarter for Northwest Arkansas was down roughly 5% over the same quarter last year. The value of permits was down 4%,” Collins noted in his analysis. “The region continues to out-perform other metros in the state in terms of construction activity.
 “For example, values for the quarter were almost two times that of Central Arkansas. Given the growth rate of permits and concern by many in the construction and lending industry about potential over-building, the slowdown may be positive news.”
The eight categories measured to determine The Compass Report grade in the Central Arkansas, Fort Smith and Northwest Arkansas areas are: total nonfarm jobs, unemployment rate, building permits, sales tax revenue, manufacturing jobs, service sector jobs, construction jobs, tourism jobs and concentration of manufacturing jobs. Because the data is not available, construction and tourism jobs are not included in the Jonesboro metro grade.
Following are third and fourth quarter summaries for the four regions.
FORT SMITH REGION
Fourth Quarter
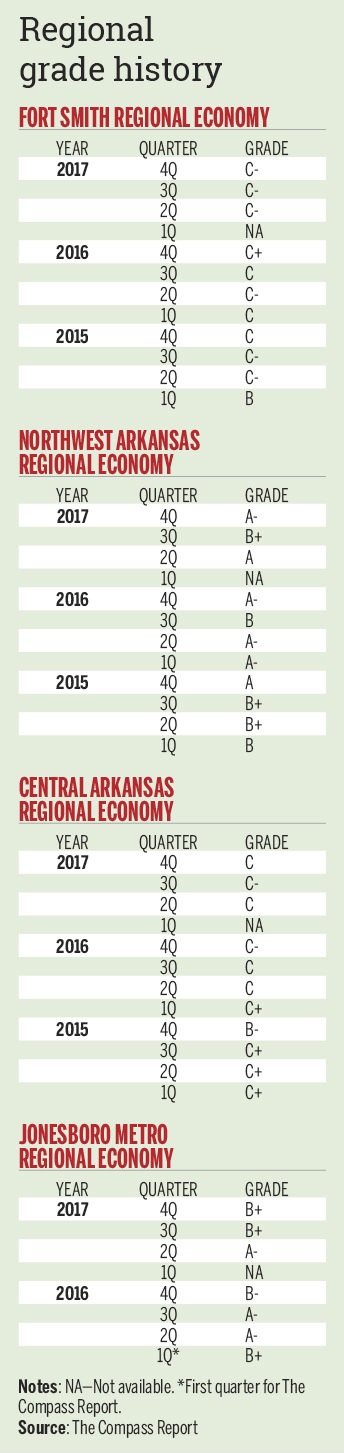
The Compass Report for the Fort Smith area posted a C- grade for the fourth quarter, down from the C+ in the same quarter of 2016.
 A continuing decline in the number of nonfarm jobs, especially in manufacturing and tourism, contributed to the lower grade. However, regional building permit values were up almost 39% in the quarter compared with the same quarter in 2016.
Third Quarter
The Compass Report for the Fort Smith area posted a C- grade for the third quarter, unchanged compared to the second quarter but below the C in the same quarter of 2016.
Declines in employment, especially in the manufacturing, tourism and construction sectors, offset the slight gain in regional sales and use tax revenue, and a slight gain in housing permit values. The unemployment rate falling to 4% is more a function of a slow growing labor force than job gains.
“The Fort Smith regional economy appears to be struggling to find its footing,” Collins said. “Certainly employment numbers fail to signal anything resembling growth. The key economic indicators that indicate positive momentum are building permit activity and retail sales. The greatest concern is that many people may have left the labor force and perhaps the region as employment opportunities have disappeared.”
NORTHWEST ARKANSAS
Fourth Quarter
The Northwest Arkansas area posted an A- grade for the fourth quarter, unchanged compared with same quarter of 2016. Growth in job numbers and sales tax revenue show a strong economy.
The number of jobs totaled 256,600 in December, well ahead of the 249,600 in December 2016. The region’s tourism industry posted employment at 25,100 in December, better than the 23,900 in December 2016.
Third Quarter
The Northwest Arkansas area posted a B+ grade for the third quarter, better than the B in the same quarter of 2016. The improvement is a reflection of gains in job growth and construction activity.
The number of nonfarm jobs totaled 256,100 in September, well ahead of the 249,300 in September 2016. Regional permit values totaled $80.44 million in September, much higher than the $63.79 million in September 2016.
“As the retail sector continues to evolve, it will be interesting to observe what impact, if any, this will have on Walmart and the vendor community in Northwest Arkansas,” Collins said.
CENTRAL ARKANSAS
Fourth Quarter
In the fourth quarter of 2017, the state’s largest metro area posted a C, better than the C- in same quarter of 2016. Job gains and healthy gains in building activity were key parts of the improvement.
The number of jobs totaled 362,800 in December, better than the 356,600 in December 2016. Regional residential building permits totaled $42.99 million in December, well ahead of the $23.79 million in December 2016.
Third Quarter
In the third quarter of 2017, the state’s largest metro area posted a C-, just below the C in the third quarter of 2016. Slower job growth in the region’s manufacturing and tourism sectors helped keep the grade from improving.
The number of jobs totaled 356,700 in September, just above the 355,300 in September 2016. The region’s tourism industry posted employment at 33,000 in September, down from the 34,000 in September 2016.
“The labor force and employment both improved, but the number of unemployed also increased. This is indicative of improving economic conditions inducing new entrants into the labor market,” Collins said.
JONESBORO METRO
Fourth Quarter
The region posted a fourth quarter grade of B+, better than the B- in the same quarter of 2016. Continuing job growth and housing permits resulted in the better economy.
Nonfarm jobs totaled 58,400 in December, up from 56,800 in December 2016. Permit values for regional residential housing were up more than 24% in the quarter compared with the same quarter in 2016.
Third Quarter
The region posted a third quarter grade of B+, down from the A- in same quarter of 2016. The Jonesboro metro began its first quarter in The Compass Report with a B+ in the first quarter of 2016.
Nonfarm employment grew in the second quarter. Nonfarm jobs totaled 57,400 in September, up from 56,600 in September 2016.
“Employment conditions in the metro are very good relative to the state and most other metro areas. The employment data are particularly encouraging given the erosion of manufacturing employment prevalent across many metros as well as the overall weak performance of the state economy,” Collins said.
DATA AND ANALYSIS
Link here for the third quarter 2017 raw data (PDF) for all regions.
Link here for the fourth quarter 2017 raw data for all regions.
Link here for the fourth quarter narrative report – “key takeaways” – raw data for all regions.
UNDERSTANDING THE COMPASS REPORT
A key factor in understanding The Compass Report is understanding the “grading” approach used to measure the current and leading economic indicators.
The strategy is to place the most recent data in historical context. Average values for the percent change over the referenced time period were calculated, as were standard deviations for each measure. The more similar current values are to historic averages, the more likely the indicator grade is to be a C.
The farther away the observed value, as measured by the standard deviation of the data, the more divergent the grade from a C. In other words, a C grade reflects no change in economic activity. The grades B or A indicate improvement above the historical average, and D and F indicate a decline in economic activity compared to the historical average.