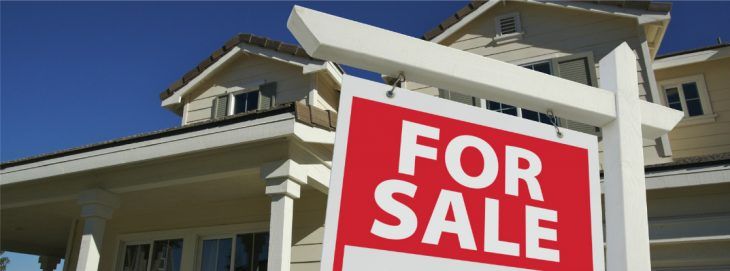
Sebastian County gains push Fort Smith home sales market up over 3% for year
by December 20, 2017 10:59 am 297 views

A significant increase in month-to-month home sales for Sebastian County pushed the Fort Smith home sales market – Crawford, Sebastian counties – to a more than 11% gain for November, continuing the year-to-date improvement over 2016.
The combined market, according to data provided by Kevin King of Weichert Realtors-King Realty Group, logged $32.688 million in sales on a total of 172 units sold compared to $29.426 million on 178 units in November 2016, a gain of 11.09% on volume despite selling 3.37% less inventory.
With 11 months completed, the total pushed further past the $300 million mark, which was broken in October, logging $345.456 million (2,077 units) against $327.181 million (2,046) the previous year, gains of 5.59% and 1.52%, respectively.
Crawford County has shown the more significant percentage improvements year-to-date with $95.586 million logged through November compared to $84.872 million the previous year, an increase of 12.62%. The improvement in units sold was almost half of that percentage-wise, moving to 639 units from 608 the previous year, a 5.1% gain.
Sebastian County also posted gains, adding to its overall performance in the last 30 days. Year-to-date, the county that houses most of the market’s home sales activity logged $249.87 million in sales against $242.309 million the previous year, a gain of 3.12%, which is up from the 0.81% gain through the end of October (a 2.31% swing).
In November, Sebastian County reported $25.329 million in sales against $20.067 million the previous year. The county witnessed an uptick in unit sales last month as well, bringing year-to-date inventory sales equal to YTD 2016 totals. For November, the county moved 127 units against 114, a gain of 11.4%. This brings the overall units sold to 1,438 through November for both 2017 and 2016.
For the year, Sebastian County showed a 19.85% drop in the time it takes for a house to sell. The YTD figure is 105 days against 131 last year. Sales prices have moved to $154,592 for the year, up 4.19% compared to 2016’s $149,694. On the Crawford County side, DOM is at 111 days for the year against 131 last year, a drop of 15.27%, while sales prices are $130,663 against $125,437, a 4.17% improvement.
BY THE NUMBERS (Jan.-Nov. for 2017; full year numbers for 2016, 2015)
• Crawford County
Unit Sales
2017: 639
2016: 670
2015: 606
Sales Volume
2017: $95.586 million
2016: $93.499 million
2015: $83.5 million
Average Sales Price
2017: $130,663
2016: $125,350
2015: $120,145
• Sebastian County
Unit Sales
2017: 1,438
2016: 1,557
2015: 1,459
Sales Volume
2017: $249.87 million
2016: $262.523 million
2015: $230.742 million
Average Sales Price
2017: $154,592
2016: $148,236
2015: $140,435
