The Compass Report: State’s top four metro economies end 2016 on a mixed note
by May 22, 2017 5:37 pm 1,187 views

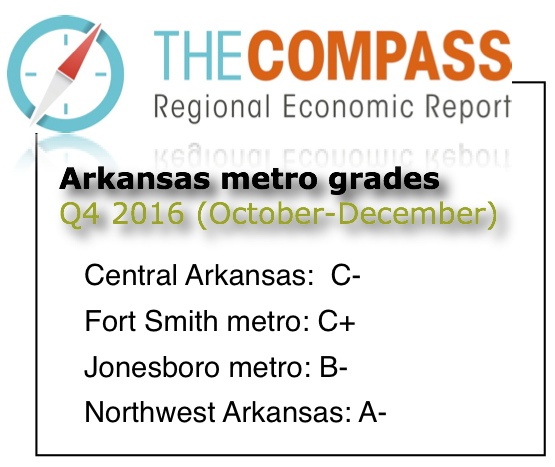
Economic conditions in four Arkansas metro areas were mixed in the final quarter of 2016, with the Northwest Arkansas and Fort Smith metros ending the year on a positive note relative to the third quarter.
Compared to the third quarter of the year, Central Arkansas and the Jonesboro metro showed slight declines. Compared to the fourth quarter of 2015, the pace of economic growth was down slightly in Central Arkansas and in Northwest Arkansas, up in the Fort Smith metro, and slightly better in the Jonesboro metro.
The quarterly Compass Report is managed by Talk Business & Politics, and is sponsored by Lowell-based Zero Mountain Logistics, a subsidiary of Fort Smith-based Zero Mountain Inc. The report is the only independent analysis of economic conditions in four Arkansas metro areas – Central Arkansas, Northwest Arkansas, Fort Smith metro, and the Jonesboro metro.
To underscore the impact of the four largest metro areas, for December the unemployment rate for the rest of the state was 4.2%. The statewide unemployment rate with the three largest metros added back in was 3.8%. The gap had been much greater but much of the state, at least in terms of unemployment rate, has improved. For example, the Pine Bluff Metro area unemployment rate (typically the highest in the state) was 5.1% in December.
Nonfarm jobs in central Arkansas fell by 0.16% between December 2016 and December 2015, was up 2.58% in Northwest Arkansas, down 0.17% in the Fort Smith metro, and rose 2.34% in the Jonesboro metro.
Jeff Collins, the economist for Talk Business & Politics who gathers data used in The Compass Report, said the star of the state’s economy continues to be Northwest Arkansas, with construction growth showing an impressive rebound.
“Since the height of the recession when sector employment fell to just over 7,000 jobs, the sector has grown by approximately 43%. December-on-December sector employment was up 1% (100 jobs) driven by consistent growth in permit activity and trend growth. Based on permit data the sector employment is likely to grow in the coming quarters,” Collins noted.
Collins said the national economy continues to do well and that is providing more impetus for consumer spending.
 “Consistent improvement in the national economy has positively impacted consumer confidence. Despite the stubbornly high unemployment rates, consumer spending has been relatively strong. Real retail and food service sales grew at an annualized rate of 2.3 percent in December. Cheaper imports, rising incomes, and low energy prices have increased household buying power and this was reflected in the data,” Collins noted.
Following are some of the risks to the national and state economy, according to Collins.
• GDP growth will continue to depend on consumer willingness to spend. It remains to be seen if business investment will accelerate or continue to show mixed results. Analysts expect fiscal stimulus in the form of increased spending and tax cuts but the impact of both is at least a year out, assuming they occur at all.
• Any number of national or international factors could create reduce consumer confidence. This is particularly true to the extent that international events impact the equity markets. For some time terrorism had been the most likely threat but escalation of conflicts in the Middle East and the Korean peninsula are increasingly troubling.
• The structure of the economy will continue to move towards more automation. In addition, immigration policies which increase domestic production costs will accelerate the adoption of labor saving technologies.
• Proposed increased government spending does have the potential to create imbalances leading to inflation. In addition, protectionist policies designed to impact domestic employment would likely lead to price increases.
FORT SMITH REGION
The Compass Report for the Fort Smith area posted a C+ grade for the fourth quarter, better than the C in the third quarter of 2016 and better than the C in the same quarter of 2015.
Helping to drive the slightly better gain was an improvement in the regional jobless rate, minor gains in regional sales tax revenue, rising construction activity, and continued growth in the region’s tourism industry.
 Job growth continues to be a problem in the metro. The number of jobs totaled 114,500 in December, down 200 jobs from the 114,700 in December 2015. By contrast, total employment in December 2006, prior to the recession, was 122,504.
Collins said the regional economy may have “right-sized” to a new level of post-Recession employment.
“The fundamental shifts in sector employment witnessed earlier have stabilized. The unfortunate aspect is that many people have left the labor force and perhaps the region as employment opportunities have disappeared. The current situation is an economy at or close to full employment. Tax collections and building permit data indicate solid economic activity.”
NORTHWEST ARKANSAS
The Northwest Arkansas area posted an A- grade for the fourth quarter, better than the B in the third quarter and just below the A in the fourth quarter of 2015. As noted in the third quarter report, the decrease is a reflection of more modest economic growth and does not suggest an economic downturn.
The number of jobs totaled 249,600 in December, well ahead of the 243,300 in December 2015. Manufacturing jobs grew from 27,200 in December 2015 to 27,400 in December 2016. The region’s tourism industry slowed during the quarter, with employment at 23,900 in December, just below the 24,100 in December 2015.
Sales tax revenue in the region continues to grow. Collections in Benton, Madison and Washington counties totaled $9.293 million in December, better than the $8.649 million in December 2015. Tax revenue growth in the region is even more impressive when compared with the larger central Arkansas metro.
“The Northwest Arkansas regional economy had sales and use tax collections totaling roughly $25.8 million in the quarter while the Central Arkansas regional economy had collections for the same period of roughly $27.5 million,” he noted.
CENTRAL ARKANSAS
For the fourth quarter of 2016, the state’s largest metro area posted a C-, down from a C in the third quarter and below the B- in the fourth quarter of 2015.
Pulling the grade down was a decline in job growth during the quarter, relatively flat sales tax revenue and declines on construction and manufacturing jobs. The number of jobs totaled 356,600 in December, below the 357,200 in December 2015.
“It was a mixed picture in government services and trade, transportation, and utilities, the two largest sectors of the Central Arkansas economy. December-on-December government services employment was down 700 jobs, or roughly 1%. Trade, transportation, and utilities gained 800 jobs, or 1.1%,” Collins said.
Regional sales tax revenue totaled $10.168 million in December, down from the $10.481 million in December 2015.
“Comparing the fourth quarter to the same period for the previous year, sales and use tax data indicates that retail activity decreased for the metro area by approximately 0.7 percent. All of the smaller counties which comprise the Central Arkansas metro saw growth in quarterly collections.”
JONESBORO METRO
The region posted a fourth quarter grade of B-, down from the A- in the third quarter. The Jonesboro metro began its first quarter in The Compass Report with a B+ in the first quarter of 2016.
Nonfarm employment grew in the fourth quarter. Non-farm jobs totaled 56,800 in December, up from 55,500 in December 2015. Non-farm employment continued to expand for the fourth quarter of 2016. For the quarter the metro added roughly 1,300 jobs. This was an increase of 2.3%. Growth was off slightly from pace reported in the third quarter (3%).
“Employment conditions in the metro are very good relative to the state and most other metro areas,” Collins noted. “The employment data are particularly encouraging given the erosion of manufacturing employment prevalent across many metros as well as the overall weak performance of the state economy.”
Sales tax revenue and building permit values also grew for the region in the fourth quarter although somewhat at a slower pace than in recent quarters. Sales tax revenue in Craighead and Poinsett counties was $2.308 million in December, just above the $2.264 million in December 2015. The number of building permits in the fourth quarter were up approximately 57% while the valuation of permits was up roughly 36%.
DATA AND REPORT DOCUMENTS
Link here for the raw data used to prepare The Compass Report for the four metro areas.
Link here for more narrative about regional and national economic conditions.
UNDERSTANDING THE COMPASS REPORT GRADES
A key factor in understanding The Compass is in understanding the “grading” approach used to measure the current and leading economic indicators.
The strategy is to place the most recent data in historical context. Average values for the percent change over the referenced time period were calculated, as were standard deviations for each measure.
The more similar current values are to historic averages the more likely the indicator grade is to be a “C.”
The farther away the observed value, as measured by the standard deviation of the data, the more divergent the grade from “C.” In other words, “C” reflects no change in economic activity. The grades “B” or “A” indicate improvement above the historical average, and “D” and “F” indicate a decline in economic activity compared to the historical average.
REGIONAL GRADE HISTORY
FORT SMITH REGION – Fort Smith regional economy
4Q 2016: C+
3Q 2016: C
2Q 2016: C-
1Q 2016: C
4Q 2015: C
3Q 2015: C-
2Q 2015: C-
1Q 2015: B
4Q 2014: C+
3Q 2014: C+
2Q 2014: C
1Q 2014: C
4Q 2013: C+
3Q 2013: C+
2Q 2013: C
1Q 2013: C-
4Q 2012: C
3Q 2012: C-
2Q 2012: C-
1Q 2012: C-
4Q 2011: C-
3Q 2011: C
2Q 2011: C
1Q 2011: C-
4Q 2010: C-/D+
3Q 2010: C-
2Q 2010: C-
1Q 2010: C-
4Q 2009: D
3Q 2009: D
2Q 2009: D-
1Q 2009: D+
NORTHWEST ARKANSAS – Northwest Arkansas regional economy
4Q 2016: A-
3Q 2016: B
2Q 2016: A-
1Q 2016: A-
4Q 2015: A
3Q 2015: B+
2Q 2015: B+
1Q 2015: B
4Q 2014: B
3Q 2014: B+
2Q 2014: B
1Q 2014: B-
4Q 2013: B+
3Q 2013: B+
2Q 2013: B
1Q 2013: B
4Q 2012: C
3Q 2012: B+
2Q 2012: B-
1Q 2012: B-
CENTRAL ARKANSAS – Central Arkansas regional economy
4Q 2016: C-
3Q 2016: C
2Q 2016: C
1Q 2016: C+
4Q 2015: B-
3Q 2015: C+
2Q 2015: C+
1Q 2015: C+
4Q 2014: C+
3Q 2014: C
2Q 2014: C
1Q 2014: C-
4Q 2013: C-
3Q 2013: C-
2Q 2013: C-
1Q 2013: C-
4Q 2012: B-
3Q 2012: C-
2Q 2012: C+
1Q 2012: C-
JONESBORO METRO – Northeast Arkansas regional economy
4Q 2016: B-
3Q 2016: A-
2Q 2016: A-
1Q 2016: B+