Arkansas Tourism Ticker: State Restaurants, Hotels Busy To Start 2015
by July 23, 2015 11:25 pm 650 views
Editor’s note: The Arkansas Tourism Ticker is sponsored by the Arkansas Hospitality Association with research and content managed by The City Wire. It is published every two months.
Arkansas’ 2% tourism tax continues to set records for monthly collections, and 16 of the 17 cities reviewed for the Arkansas Tourism Ticker posted hospitality tax revenue gains through the first four months of 2015. The period continues the positive trends that began in 2014.
The Arkansas Tourism Ticker shows that the three key measurements of Arkansas’ leisure and hospitality sector between January and April posted healthy gains over the same period in 2014. The ticker is sponsored by the Arkansas Hospitality Association and managed by The City Wire, and uses the following three measurements to review the health of the state’s tourism industry. The Arkansas Tourism Ticker will be produced every two months, or six times a year.
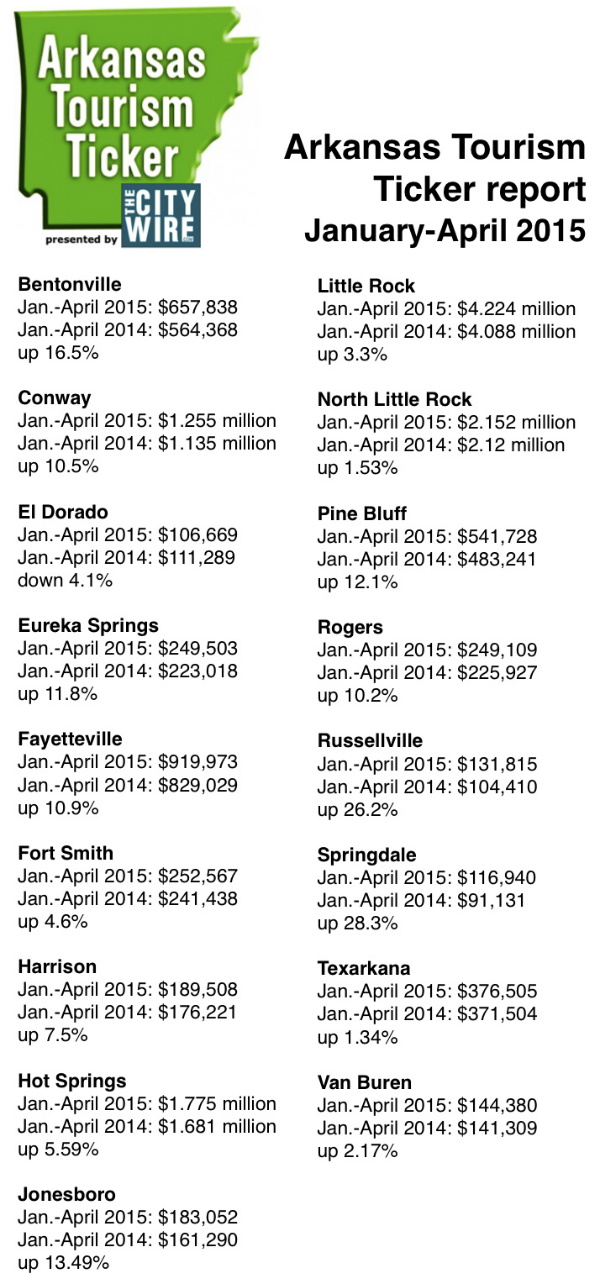
• Hospitality tax collections – prepared food tax and lodging tax – of 17 Arkansas cities (cities listed below and in included image);
• Tourism sector employment numbers as reported by the U.S. Bureau of Labor Statistics; and
• Collections of Arkansas’ 2% statewide tourism tax.
Results for the January-April ticker report are:
+6.06%
Gain in combined January-April hospitality tax collections in 17 Arkansas cities compared to the same period in 2014
+7.25%
January-April gain in Arkansas’ 2% tourism tax compared to the same period in 2014
+6.51%
Increase in average Arkansas’ tourism industry jobs during January and April compared to January-April 2014
The inaugural Ticker report showed that 2014 hospitality tax revenue in the cities was up 3.7% over 2013; Arkansas’ 2% tourism tax revenue in 2014 was up 7.48% compared to 2013; and jobs in the state’s travel and tourism sector were up 6.5% in 2014 compared to 2013.
HOSPITALITY TAXES
The combined hospitality tax collections in the 17 cities totaled $13.523 million in January-April, up 6.06% compared to January-April 2014.
Restaurant (prepared food tax) tax collections among the 17 cities totaled $10.276 million in January and April, up 5.93% compared to the $9.7 million in January-April 2014.
Hotel tax collections among the 17 cities totaled $3.247 million in the January-April period, up 6.49% compared to the $3.049 million during the same period of 2014.
Gains during the four-month period ranged from 28.3% in Springdale to 1.53% in North Little Rock. During the January-April period, only El Dorado saw a hospitality tax collection decline.
STATEWIDE TOURISM TAX
Collections of Arkansas’ 2% tourism tax in January and April totaled $4.247 million, up 7.25% compared to the $3.96 million in January-April of 2014. Collections for each of the four months of 2015 set a new record for that month.
The 2% tourism tax in 2014 totaled $13.677 million, up 7.48% compared to the $12.716 million collected in 2013. The 2014 tally sets a new record for the tax. Following are the past five years of 2% tax collections.
2014: $13.677 million
2013: $12.716 million
2012: $12.404 million
2011: $12.025 million
2010: $11.492 million
TOURISM JOB NUMBERS
The monthly jobs average in the travel and tourism sector during January and April was 113,600, up 6.51% compared to an average of 106,650 during the first four months of 2014.
Travel and tourism sector employment ranged from a low of 112,100 in January to a high of 114,800 in February. The February level, if it is not revised, set a new record for the sector. Travel and tourism sector employment during the first four months of 2014 ranged from a 106,200 low in January to a high of 107,500 in April.
Job growth in the sector has been significant during the past 10 years. April employment of 113,900 is up 20.5% compared to April 2005 employment of 94,000.
Of the eight metro areas in or connected to Arkansas, the Bureau of Labor Statistics provides tourism employment data on five. The Fort Smith and Memphis-West Memphis areas were the only metro areas to see travel and tourism sector employment declines in the January-April period. Following are comparisons of the monthly employment averages in the January-April period.
Northwest Arkansas
Jan.-April 2015: 21,700
Jan.-April 2014: 21,225
Jan.-April 2010: 17,350
Fort Smith
Jan.-April 2015: 8,775
Jan.-April 2014: 8,925
Jan.-April 2010: 8,300
Central Arkansas (Little Rock-North Little Rock-Conway)
Jan.-April 2015: 32,750
Jan.-April 2014: 31.225
Jan.-April 2010: 28,575
Memphis-West Memphis
Jan.-April 2015: 62,300
Jan.-April 2014: 63,750
Jan.-April 2010: 63,700
Texarkana (Arkansas-Texas)
Jan.-April 2015: 6,250
Jan.-April 2014: 5,950
Jan.-April 2010: 5,525
WHY THE TICKER?
Arkansas’ tourism industry is an important economic engine for the state, and is often cited as Arkansas’ second largest industry – behind agriculture.
There are many reports and economic indices to measure several areas of the the state’s economy. The City Wire issues a monthly housing report (The Arkansas Home Sales Report). The University of Arkansas issues a quarterly report on economic activity, and has published reports on the economic impact of the Fayetteville Shale Play. There are reports to measure public opinion on various social issues.
But there has not been an independent report looking at the health of the state’s tourism sector. Therefore, The City Wire decided to work with officials in the state’s travel and tourism sector to capture some indication of the relative health of the industry.


