The Compass Report: Two of Arkansas’ three large metro areas stable in the second quarter
by November 5, 2015 5:57 pm 517 views

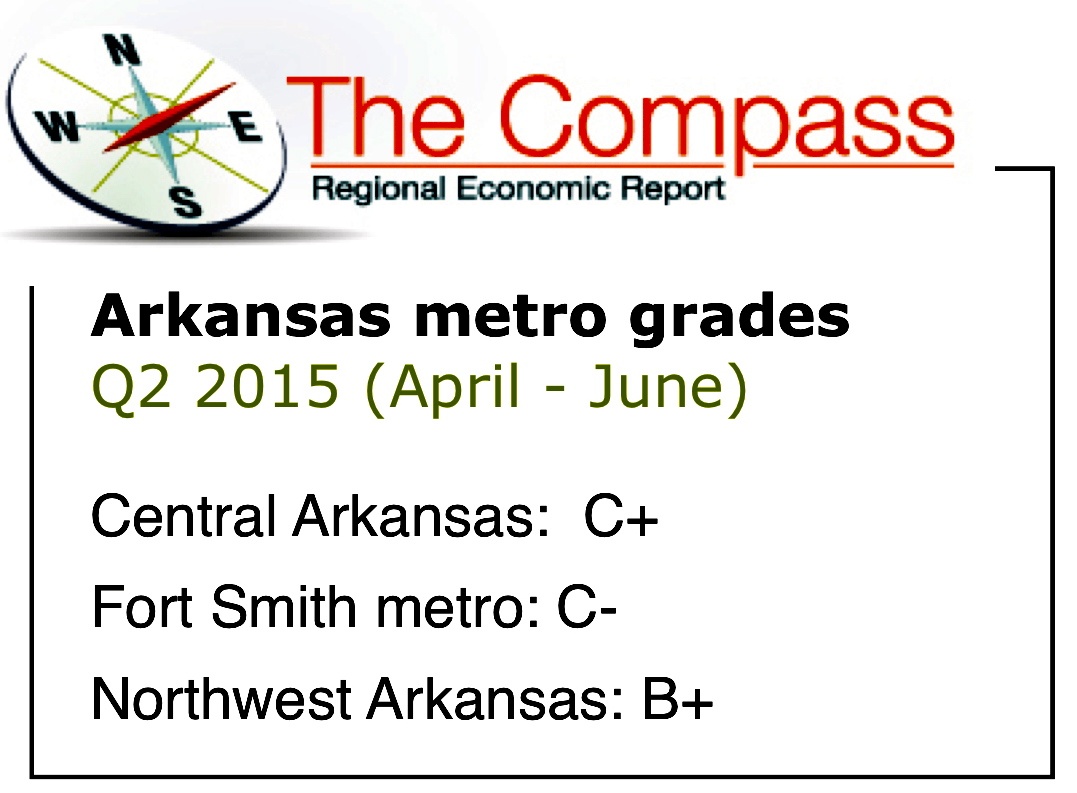
Two of Arkansas’ largest metro areas continued to see economic improvements during the second quarter of 2015, with the Fort Smith metro economy falling back slightly because of poor job growth and a decline in building activity. The second quarter follows a first quarter in which all three metro areas posted year-over-year gains.
Compared to the second quarter of 2014, economic conditions were stable and growing in Central Arkansas and Northwest Arkansas, respectively, and down in the Fort Smith metro. The second quarter dip in the Fort Smith area follows a first quarter in which it posted its best results since the first quarter of 2009.
The quarterly Compass Report is managed by Talk Business & Politics, and is sponsored in the Fort Smith area by Arvest Bank. The report is the only independent analysis of economic conditions in Arkansas’ three largest metro areas.
To underscore the impact of the three largest metro areas, for the second quarter of this year the unemployment rate for the rest of the state was 6.7%. The statewide unemployment rate with the three largest metros added back in was 5.6% June-on-June.
 The broader national economy also continues to do well, albeit at a modest pace. The second half of 2015 is likely to see the growth continue thanks to gains in incomes and employment, and positive market conditions for the housing industry, said Jeff Collins, the economist for Talk Business & Politics who gathers the extensive data used in The Compass Report. He also is a former director of the Center for Business and Economic Research at the University of Arkansas.
Of the 387 MSAs (metropolitan areas) in the country, only 5 posted rates above 10% in June and 6 had rates below 3%. No Arkansas MSA had a rate above 8%,” Collins noted in the second quarter report. “Non-farm employment has grown for the last 19 quarters. The economy created roughly 692,000 non-farm jobs in the second quarter after creating 586,000 in the first quarter.”
Collins also said low and declining fuel prices “are like a tax holiday for the consumer.” In addition to lower fuel prices, Collins noted that consumer demand continues to grow, with consumption expenditures up 3.6% in the second quarter compared to a 1.8% gain in the first quarter.
FORT SMITH REGION
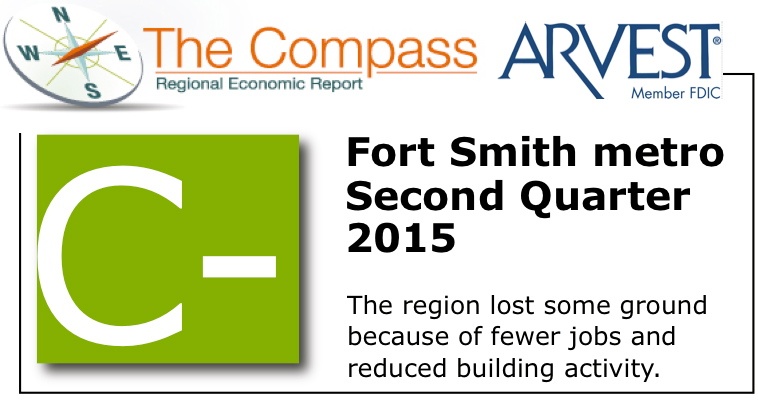 The Compass Report for the Fort Smith area posted a C- grade for the second quarter, down from the B in the first quarter of 2015 and down from the C in the second quarter of 2014.
Fort Smith’s metro economy was not able to build on gains seen in the first quarter. Although the region’s jobless number declined (5.9% in June 2015, compared to 6.3% in June 2014), the number of jobs fell. Non-farm employment in the metro area peaked at 113,500 in the first quarter, but ended June at 112,600. That down from a second quarter 2014 peak of 113,600 and June 2014 at 113,300 jobs.
Residential construction as measured by number of permits and value was down significantly quarter-on-quarter – 30% and 39%, respectively. Sales and use tax revenues, reported by the Arkansas Department of Finance and Administration, were down quarter-on-quarter 1% after adjusting for the increased rate in Crawford County.
The Fort Smith region has struggled to regain jobs lost during the Great Recession. The June 2015 report from the federal Bureau of Labor Statistics shows 115,084 jobs in the metro area, down more than 10,000 jobs compared to June 2006 when an estimated 125,426 people had jobs in the area.
“Data for the Fort Smith regional economy had been mixed for some time. The obvious conclusion is that the region has stabilized but there is no obvious source of growth which could change the current trend. Barring some unforeseen factor, look for the metro area economy to languish,” Collins noted in the report.
Mike Jacimore, sales manager for Arvest Bank in Fort Smith and the River Valley Region, said he remains upbeat about the future of the regional economy.
“Despite not being able to maintain some of the gains we as a region made in the first quarter, we are still encouraged by some of the indicators we’re seeing. As we’ve seen this year from the groundbreaking ceremonies by Arkansas Colleges of Health Education and ArcBest Corporation, Fort Smith is moving in a very positive direction which should help drive these indicators upward in the future. We are proud of Fort Smith and look forward to helping our customers and the region as a whole however we can,” Jacimore said.
NORTHWEST ARKANSAS
The pace of job growth, tax revenue gains and building activity produced a not surprising grade of B+ for the Northwest Arkansas economy during the second quarter. The grade was up from a B grade in the first quarter of 2015 and better than the B in the second quarter of 2014.
Nonfarm employment grew rapidly June-on-June. The metro economy added roughly 5,600 job, up 2.5%. Also, improved construction activity has translated into improved employment in the sector. Since the height of the recession when sector employment fell to a little more than 7,000 jobs, the sector has grown by approximately 20%. June-on-June the sector was unchanged despite strong permit activity and trend growth. Based on permit data the sector is likley to continue to add employment in the next two quarters.
Overall, the labor force grew June-on-June in Northwest Arkansas by roughly 4.1%. By comparison, the labor force grew in Central Arkansas 2.9%, and in the Fort Smith area the labor force grew a more modest 1.7%.
Sales and use tax collection data indicate that Bentonville, Fayetteville, Springdale, and Rogers have experienced solid growth quarter-on-quarter. In percentage terms, Rogers experienced the strongest growth in collections (8.3%) while Fayetteville collected the most tax dollars of any of the four major municipalities – $10 million in the second quarter.
As he has for the past several quarters, Collins said there is no reason to believe the pace of growth in Northwest Arkansas will slow during the remainder of 2015.
CENTRAL ARKANSAS
Economic conditions in central Arkansas, the state’s largest metro area, received a grade of C+ in the second quarter, unchanged from the first quarter of 2015 and better than the C in the second quarter of 2014.
Overall job gains, especially in the construction and tourism sectors, and stability in sales tax revenue helped the region to continue gains from the first quarter. There were 352,800 non-farm jobs in the region in June, ahead of the 346,700 in June 2014.
There were an estimated 18,600 construction jobs in the region during June, well ahead of the 16,100 during June 2014. The tourism sector posted 34,500 jobs in June, better than the 33,300 in June 2014.
Comparing the most recent three-month period to the same period in 2014, sales and use tax data indicates that retail activity grew for the metro area by approximately 3.7%. The growth was led by Perry County. Collections were up quarter-on-quarter in all three major metros.
Collins said economic health for the central Arkansas metro is good for the entire state.
“Most recent economic data for Central Arkansas continues to be encouraging. The local economy had struggled to gain momentum, particularly given weak growth in the government sector. The declining unemployment rate and growth in non-farm employment are positive signs the region is returning to trend. Given the size and over-all importance of the metro to state economic performance, a return to trend growth is very positive news for the state,” Collins noted in his analysis.
U.S. ECONOMIC RISKS
Macro economic conditions always have an impact on Arkansas’ economy, and in his report Collins outlined several risks to the national economy. One of the biggest unknowns is consumer behavior.
“The U.S. economy remains heavily dependent on the consumer. Consumer confidence has improved significantly but international crisis could induce consumers to pull back. Globally, demand has softened impacting global output growth and demand for U.S. exports,” Collins noted.
Other risks include:
• While the unemployment rate has improved, it does not adequately tell the entire story. Reduced labor force participation, high unemployment rates for young and minority workers remain persistent problems.
• Income growth remains modest despite improvements in the labor market.
• The Federal Reserve has significantly reduced monetary stimulus in response to stabilized growth. However many economists are concerned about the impact on inflation of prolonged easy money.
• Low oil prices are like a tax break, but how long will they last?
DATA AND REPORT DOCUMENTS
Link here for the raw data used to prepare The Compass Report for the three metro areas.
Link here for more narrative about regional and national economic conditions.
UNDERSTANDING THE COMPASS REPORT GRADES
A key factor in understanding The Compass is in understanding the “grading” approach used to measure the current and leading economic indicators.
The strategy is to place the most recent data in historical context. Average values for the percent change over the referenced time period were calculated, as were standard deviations for each measure.
The more similar current values are to historic averages the more likely the indicator grade is to be a “C.”
The farther away the observed value, as measured by the standard deviation of the data, the more divergent the grade from “C.” In other words, “C” reflects no change in economic activity. The grades “B” or “A” indicate improvement above the historical average, and “D” and “F” indicate a decline in economic activity compared to the historical average.
REGIONAL GRADE HISTORY
FORT SMITH REGION – Fort Smith regional economy
2Q 2015: C-
1Q 2015: B
4Q 2014: C+
3Q 2014: C+
2Q 2014: C
1Q 2014: C
4Q 2013: C+
3Q 2013: C+
2Q 2013: C
1Q 2013: C-
4Q 2012: C
3Q 2012: C-
2Q 2012: C-
1Q 2012: C-
4Q 2011: C-
3Q 2011: C
2Q 2011: C
1Q 2011: C-
4Q 2010: C-
3Q 2010: C-
2Q 2010: C-
1Q 2010: C-
4Q 2009: D
3Q 2009: D
2Q 2009: D-
1Q 2009: D+
NORTHWEST ARKANSAS – Northwest Arkansas regional economy
2Q 2015: B+
1Q 2015: B
4Q 2014: B
3Q 2014: B+
2Q 2014: B
1Q 2014: B-
4Q 2013: B+
3Q 2013: B+
2Q 2013: B
1Q 2013: B
4Q 2012: C
3Q 2012: B+
2Q 2012: B-
1Q 2012: B-
CENTRAL ARKANSAS – Central Arkansas regional economy
2Q 2015: C+
1Q 2015: C+
4Q 2014: C+
3Q 2014: C
2Q 2014: C
1Q 2014: C-
4Q 2013: C-
3Q 2013: C-
2Q 2013: C-
1Q 2013: C-
4Q 2012: B-
3Q 2012: C-
2Q 2012: C+
1Q 2012: C-